A steep fall in imports helped India’s merchandise trade deficit shrink to $14.05 billion in February 2025. While the shorter month played a role, back-ended import reporting also contributed to the sharp drop. Gold imports continued to decline, and crude oil purchases plunged nearly 30% year-on-year.
Exports and Imports: The Changing Landscape
India’s export sector saw mixed trends in February. While some categories performed well, others took a hit. The key contributors to outbound shipments were:
- Engineering Goods: $9.08 billion (-8.6%)
- Petroleum Products: $5.81 billion (-29.2%)
- Electronic Goods: $3.79 billion (+26.5%)
- Gems & Jewellery: $2.53 billion (-20.7%)
- Drugs & Pharmaceuticals: $2.47 billion (-1.5%)
- Organic & Inorganic Chemicals: $2.23 billion (-24.5%)
Imports, on the other hand, saw a significant decline in categories like crude oil and gold. Key import figures for February included:

- Crude & Petroleum Products: $11.89 billion (-29.6%)
- Electronic Goods: $7.57 billion (+9.1%)
- Machinery: $4.32 billion (+5.3%)
- Transport Equipment: $2.61 billion (-16.9%)
- Gold: $2.34 billion (-62.0%)
- Coal, Coke, Briquettes: $2.06 billion (-35.6%)
India’s Key Trade Partners
The United States remained India’s top export destination in February 2025, with shipments worth $7.91 billion. The UAE followed, with $3.28 billion in exports. Other key destinations included:
- Netherlands: $1.93 billion
- China: $1.26 billion
- United Kingdom: $1.17 billion
- Saudi Arabia: $1.06 billion
On the import side, China retained its position as India’s largest supplier, accounting for $8.72 billion in shipments. The UAE, Russia, and the U.S. were also among the major sources:
- United Arab Emirates: $5.21 billion
- Russia: $3.86 billion
- United States: $3.05 billion
- Saudi Arabia: $2.16 billion
- Iraq: $1.79 billion
- Singapore: $1.65 billion
The One-Year Trade Trajectory
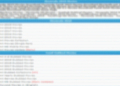
A look at India’s trade performance over the last year shows a fluctuating trend in both exports and imports. Here’s how the trade figures compare month by month:
| Month | Exports ($B) | Imports ($B) | Trade Deficit ($B) |
|---|---|---|---|
| Feb-24 | 41.40 | 60.11 | -18.71 |
| Mar-24 | 41.68 | 57.28 | -15.60 |
| Apr-24 | 34.99 | 54.09 | -19.10 |
| May-24 | 38.13 | 61.91 | -23.78 |
| Jun-24 | 35.20 | 56.18 | -20.98 |
| Jul-24 | 33.98 | 57.48 | -23.50 |
| Aug-24 | 34.71 | 64.36 | -29.65 |
| Sep-24 | 34.58 | 55.36 | -20.78 |
| Oct-24 | 39.20 | 66.34 | -27.14 |
| Nov-24 | 32.03 | 63.86 | -31.83 |
| Dec-24 | 38.01 | 59.95 | -21.94 |
| Jan-25 | 36.43 | 59.42 | -22.99 |
| Feb-25 | 36.91 | 50.96 | -14.05 |
February’s trade deficit was sharply lower than the 12-month average of $23 billion, primarily due to reduced imports.
Export Stars and Import Laggards
While the overall export market showed weakness, some categories recorded strong year-on-year growth:
- Tobacco: +26.8%
- Electronic Goods: +26.5%
- Mica/Coal/Ores: +24.3%
- Coffee: +22.3%
- Rice: +13.2%
- Jute: +12.4%
- Cereals: +11.7%
- Meat/Dairy/Poultry: +6.7%
- Carpets: +4.9%
- Textiles/RMG: +4.0%
- Marine Products: +3.4%
Meanwhile, several key imports fell drastically:
- Silver: -75.0%
- Gold: -62.0%
- Pearls/Precious Stones: -41.6%
- Coal/Coke/Briquettes: -35.6%
- Petroleum Products: -29.6%
The Big Picture: Trade Deficit and Current Account Impact
One of the most significant takeaways from February 2025’s data is that the services trade surplus was enough to wipe out the merchandise trade deficit. The overall trade balance swung to a surplus of $4.43 billion. Here’s how the numbers break down:
| Trade Category | Feb-25 ($B) | Jan-25 ($B) | Feb-24 ($B) | Change YOY (%) |
| Merchandise Exports | 36.91 | 36.43 | 41.41 | -10.87% |
| Merchandise Imports | 50.96 | 59.42 | 60.92 | -16.35% |
| Trade Deficit | -14.05 | -22.99 | -19.51 | -27.99% |
| Services Exports | 35.03 | 38.55 | 28.33 | +23.65% |
| Services Imports | 16.55 | 18.22 | 15.23 | +8.67% |
| Services Trade Surplus | 18.48 | 20.33 | 13.10 | +41.07% |
| Overall Trade Balance | 4.43 | -2.66 | -6.41 | -169.11% |
The current account deficit (CAD) for the first half of FY25 stands at 1.2% of GDP, with estimates suggesting it will not exceed 1.5% for the full year. The slowdown in imports and strength in services exports are keeping the CAD within control, despite global uncertainties.
For now, the trade deficit looks manageable, but with the possibility of new tariffs from the U.S., the export sector remains on edge. The full picture will emerge once the Q3 FY25 current account data is released later this month.