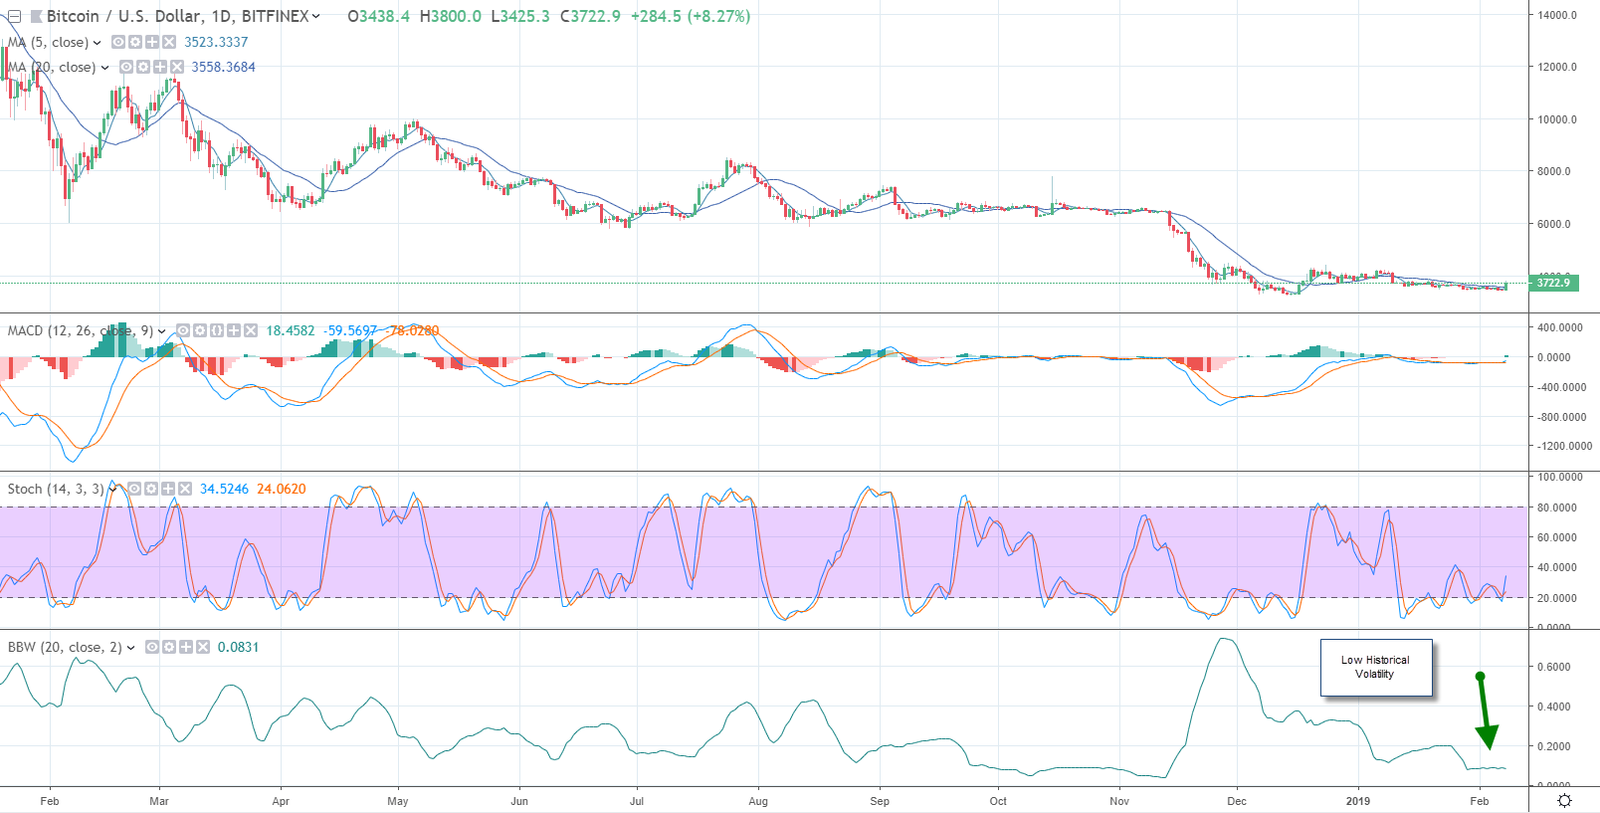
Crypto currency prices have seen historic highs but have not revisited their all-time lows and are consolidating as 2019 begins. The markets are attempting to find some value. What is clear is that volatility on crypto currency prices has tumbled, and expectations are that prices will remain rangebound. Looking forward, its not prudent to short a quiet market, and the price of the most liquid crypto currency bitcoin is quiet. Look for volatility to pick up within the next few months. There will continue to be reports that the US will approve an ETF that is based on bitcoin prices. When this occurs, a sustainable rally will likely take place as funds at bitcoin to generate a diverse portfolio that includes crypto currencies.
What Happened during the past 14-months?
Crypto currency prices experienced a very wild. The most liquid crypto currencies became known as the price of Bitcoin surged to fresh all-time highs near 19,000. Prices fell back to earth, which started as prices tumbled in the beginning of 2018, when futures exchanges introduced contracts that would allow investors to short bitcoin. The new futures contracts provide for a two-way market that did not exist prior which increased liquidity initially, but substantially reduced the price. In early 2018 volatility started to collapse until it hit a low in 2019 near 8%.

Looking Forward
While individual crypto currencies could experience a sharp rally or a steep decline based on specific news, the group of crypto currencies best represented by the price of bitcoin should begin to pick up. News in February that the SEC is closer to creating an ETF based off of bitcoin could have legs. If this does get approved, there will could more upside.
During the last 12-months there was one other period between September 2018 and November 2018 when historic volatility was very quiet. This lasted approximately 2-months. Currently, historic volatility is moving sideways at very low levels. This could continue for another month based on historic changes to volatility. The last increase in historic volatility occurred as prices moved from the 6K level to the 3.5K level.
How Do You Measure Historic Volatility?
A simple way to evaluate historical volatility is to use the Bollinger band width created using the Bollinger bands. Bollinger bands where developed by John Bollinger who created the bands to see a specific standard deviations range around a moving average. The Bollinger band width subtracts the Bollinger band high from the Bollinger band low, creating a historic volatility measure. When the Bollinger band width climbs, historical volatility is moving higher and when the Bollinger band width declines, historic volatility moves lower.
Prices remain rangebound and a new trend needs to form for prices to climb. You can track bitcoin prices on the iFOREX platform. The combination of new information, such as a new ETF and an increase in historical volatility is the recipe for higher crypto currency prices.


